One account, three reporting windows, and the numbers behind the headline. The lifetime dashboard records 54,806 attributed installs at €1.50 each. August 2026 recorded 8,096 attributed installs at €1.75 each, while August 26–September 1 recorded 1,182 at €1.77 each.
The useful story is not just the headline. It is how the results differ by market, campaign approach, and attribution type—and what those differences can teach an app developer evaluating paid acquisition.
This case study shows the numbers alongside actual dashboard screenshots. It documents reported performance, not a controlled experiment or a claim that a particular optimization caused growth.
The results at a glance
Scroll horizontally to compare every column.
| Metric | Lifetime view¹ | Aug 1–31, 2026 | Aug 26–Sep 1, 2026 |
|---|---|---|---|
| Ad spend | €82,301.52 | €14,173.31 | €2,093.26 |
| Total attributed installs | 54,806 | 8,096 | 1,182 |
| Avg CPA (Total) | €1.50 | €1.75 | €1.77 |
| Tap-through installs | 37,087 | 5,234 | 771 |
| Avg CPA (Tap-Through) | €2.22 | €2.71 | €2.72 |
| Tap-through conversion rate | 56.46% | 54.36% | 56.69% |
| Campaigns with spend | 27 | 9 | 9 |
All headline metrics above are displayed by Apple Ads. Here, acquisition cost refers to an attributed install, not a purchase.
¹ The lifetime query covers June 16, 2016–September 1, 2026, using the earliest date accepted by the dashboard and View: All. This means all history returned for this campaign group, including paused and removed campaigns. The query start is not a verified campaign launch date and does not imply continuous advertising since 2016.
These periods overlap. The lifetime view contains both shorter periods, and six days of the weekly window fall within August. Do not add these counts together or interpret this table as a before-and-after test. August is a complete 31-day calendar month, not a projection of weekly results.
Lifetime: 54,806 attributed installs

The full report contains 27 campaigns with historical spend and one removed campaign with zero reported spend. Unlike the recent snapshots, it includes results from older Spanish campaigns as well as the US, UK, and Canada campaign structure.
Two US campaigns accounted for 60% of historical spend
US Generic and US Max Conversion together accounted for €49,406.39, or approximately 60.0% of the reported spend. US Generic recorded 6,697 tap-through installs at €4.32 each; US Max Conversion recorded 6,896 at €2.97 each.
These cumulative results show where acquisition investment accumulated. They are not a head-to-head experiment: the campaigns may have run for different lengths of time and reached different searches and audiences.
Brand demand materially shaped the lifetime average
US Brand alone recorded 19,687 total attributed installs—35.9% of the lifetime total—on €13,173.01 of spend. Across all five Brand-labeled campaigns, including the older Spanish and US Brand campaigns, the report recorded 27,787 total attributed installs on €15,016.82 of spend.
That is 50.7% of lifetime total installs. The €1.50 headline therefore describes the whole historical mix, not the cost of acquiring a completely new customer through generic search.
The lifetime view establishes scale. The monthly and weekly views below describe more recent operating performance; their different costs should not be presented as an improvement or decline without accounting for campaign mix, timing, and attribution.
The account setup
In August and the seven-day window, the nine spending campaigns were organized across the United States, United Kingdom, and Canada. Each market had a campaign labeled Brand, a campaign labeled Generic – Exacte, and a Max Conversion campaign.
The dashboard displayed Manage Bids for the Brand and Generic campaigns, and Maximize Conversions for the Max Conversion campaigns. The other listed campaigns had zero spend and zero installs in both captured periods.
This structure makes country and campaign comparisons possible. However, campaign names are labels: without keyword and search-term reports, they do not prove the exact targeting or that automated campaigns excluded branded searches.
August: 8,096 installs across three markets

The US supplied the largest volume: 5,417 total attributed installs, compared with 1,385 in the UK and 1,294 in Canada.
Scroll horizontally to compare every column.
| Market | Spend | Total installs | Cost / total install | Tap-through installs | Cost / tap-through install |
|---|---|---|---|---|---|
| United States | €10,346.50 | 5,417 | €1.91 | 3,294 | €3.14 |
| United Kingdom | €2,320.49 | 1,385 | €1.68 | 1,063 | €2.18 |
| Canada | €1,506.31 | 1,294 | €1.16 | 877 | €1.72 |
Market figures are calculated from the displayed campaign rows, including Brand. Costs use total spend divided by total installs for each market—not averages of campaign CPAs. The rounded campaign spend amounts sum to €14,173.30; Apple's account total displays €14,173.31.
Canada had the lowest blended acquisition cost
Canada recorded €1.72 per tap-through install across its three campaigns. Brand contributed to that average, but the Generic campaign also recorded €2.20 per tap-through install, compared with €4.60 for US Generic—approximately 52% lower in the same month.
That is a market comparison, not proof that moving a budget to Canada would reproduce the result. Search demand, keyword mix, competition, and customer value can differ.
US Max Conversion recorded lower costs than US Generic
US Max Conversion recorded 839 tap-through installs at €3.22 each, compared with 1,219 at €4.60 for US Generic. Its tap-through acquisition cost was approximately 30% lower during August.
This establishes a difference in reported campaign outcomes. It does not isolate bidding strategy as the cause: targeting, search terms, budget, and traffic composition may differ.
Seven days: 1,182 attributed installs at €1.77 each

The seven-day report shows why the same campaign approach should be evaluated separately in each market.
Scroll horizontally to compare every column.
| Campaign | Spend | Tap-through installs | Avg CPA (Tap-Through) |
|---|---|---|---|
| US Generic | €988.53 | 185 | €5.34 |
| US Max Conversion | €268.22 | 96 | €2.79 |
| UK Generic | €221.16 | 94 | €2.35 |
| UK Max Conversion | €87.63 | 29 | €3.02 |
| CA Generic | €103.46 | 38 | €2.72 |
| CA Max Conversion | €160.17 | 67 | €2.39 |
This comparison table excludes the three Brand campaigns; the headline results and screenshots include them.
In the US, Max Conversion's tap-through acquisition cost was approximately 48% below Generic. In the UK, the ordering was reversed: Generic recorded €2.35, compared with €3.02 for Max Conversion.
UK Generic also recorded a 60.65% tap-through conversion rate and an acquisition cost approximately 56% below US Generic. These are same-period observations, not measured cost reductions from an intervention.
Brand results explain part of the headline
In August, the three Brand-labeled campaigns accounted for 3,407 total attributed installs—42.1% of the account's total—on €2,279.92 of spend.
The six remaining campaigns recorded 4,689 total attributed installs, including 3,418 tap-through installs, on €11,893.38 of displayed spend. Their calculated cost per tap-through install was €3.48, compared with the account's €2.71 blended figure.
For the seven-day window, those same six campaigns recorded 699 total attributed installs and 509 tap-through installs, at a calculated €3.59 per tap-through install.
Separating these groups avoids presenting inexpensive branded demand as the price of all prospecting. Even the remaining campaigns should not be described as purely non-brand acquisition until their search terms have been checked.
Understanding the attribution
Apple's total installs combine tap-through and view-through attribution and can include redownloads. They are not necessarily unique new users. Tap-through conversion rate measures tap-attributed installs divided by taps; it is different from the total conversion rate. Apple's reporting definitions.
The difference between total and tap-through installs was 17,719 in the lifetime view, 2,862 in August, and 411 in the seven-day window. Showing both measures keeps the €1.50, €1.75, and €1.77 headline costs in context.
These Apple Ads reports do not contain revenue, subscriptions, retention, or customer lifetime value. The separate sales screenshots below add business context, but do not establish profitability, incremental installs, or organic ASO uplift.
App Store Connect sales: the business context
The supplied App Store Connect screenshots display $1.30M in historical Sales, $127K for August, and $36.1K for the seven-day window. These are rounded dashboard totals, reproduced as shown—not exact transaction-level amounts or revenue attributed to Apple Ads. The periods overlap and must not be added together.
All three captures show UTC. The app selection, territory filters, and currency code are outside the supplied crops; the dollar symbol is retained without assuming a specific dollar currency or independently confirming that the sales scope matches the advertising scope. Select any screenshot to inspect the original at full size.
Historical sales: $1.30M
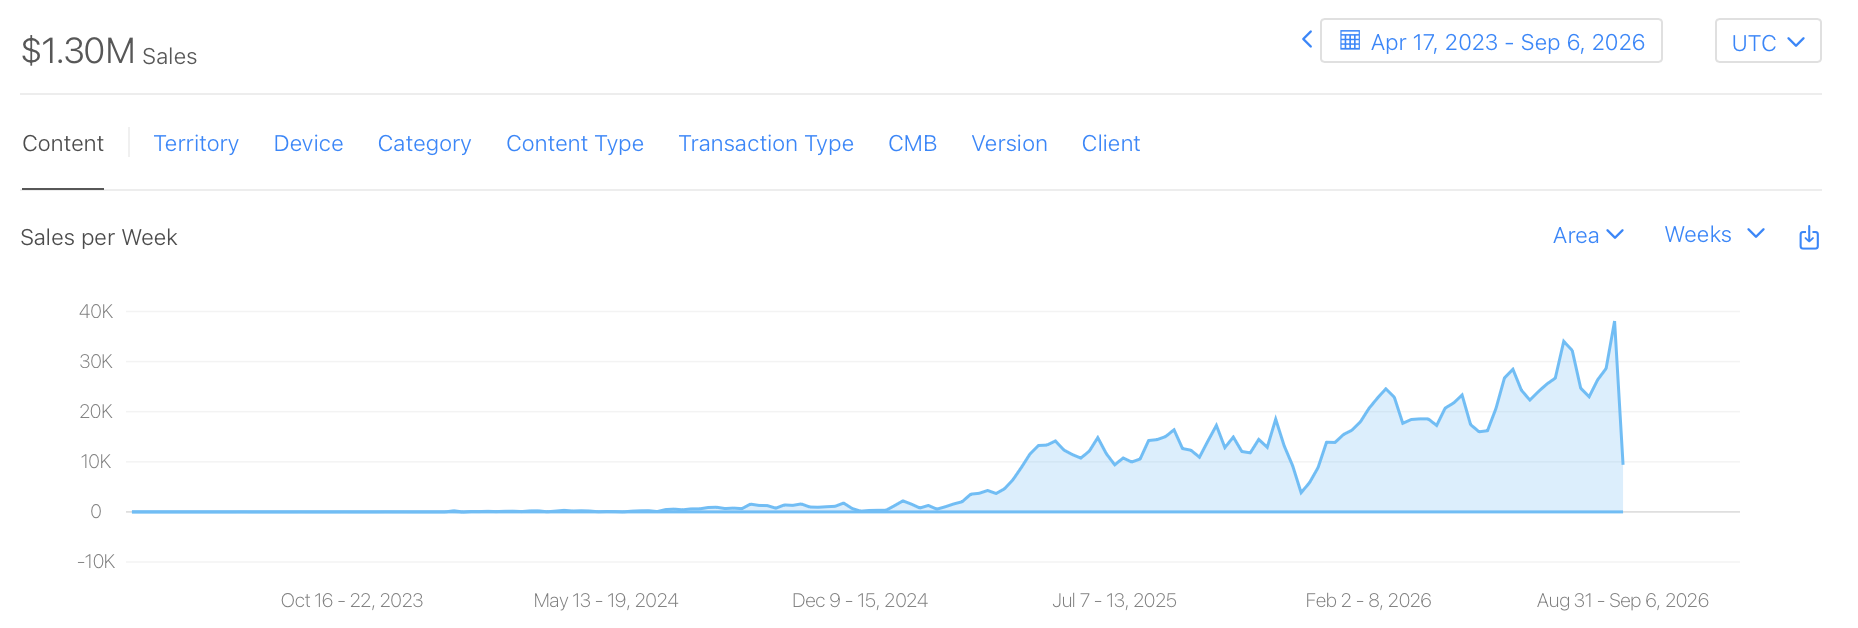
The final week is incomplete. This screenshot was supplied on September 2, 2026, but its last weekly bucket is labeled August 31–September 6. The selected end date is not evidence of sales occurring after capture, and the last point should not be read as a completed-week decline. This historical sales range also differs from the Apple Ads lifetime query; it is not independently verified as the app's entire lifetime.
August sales: $127K
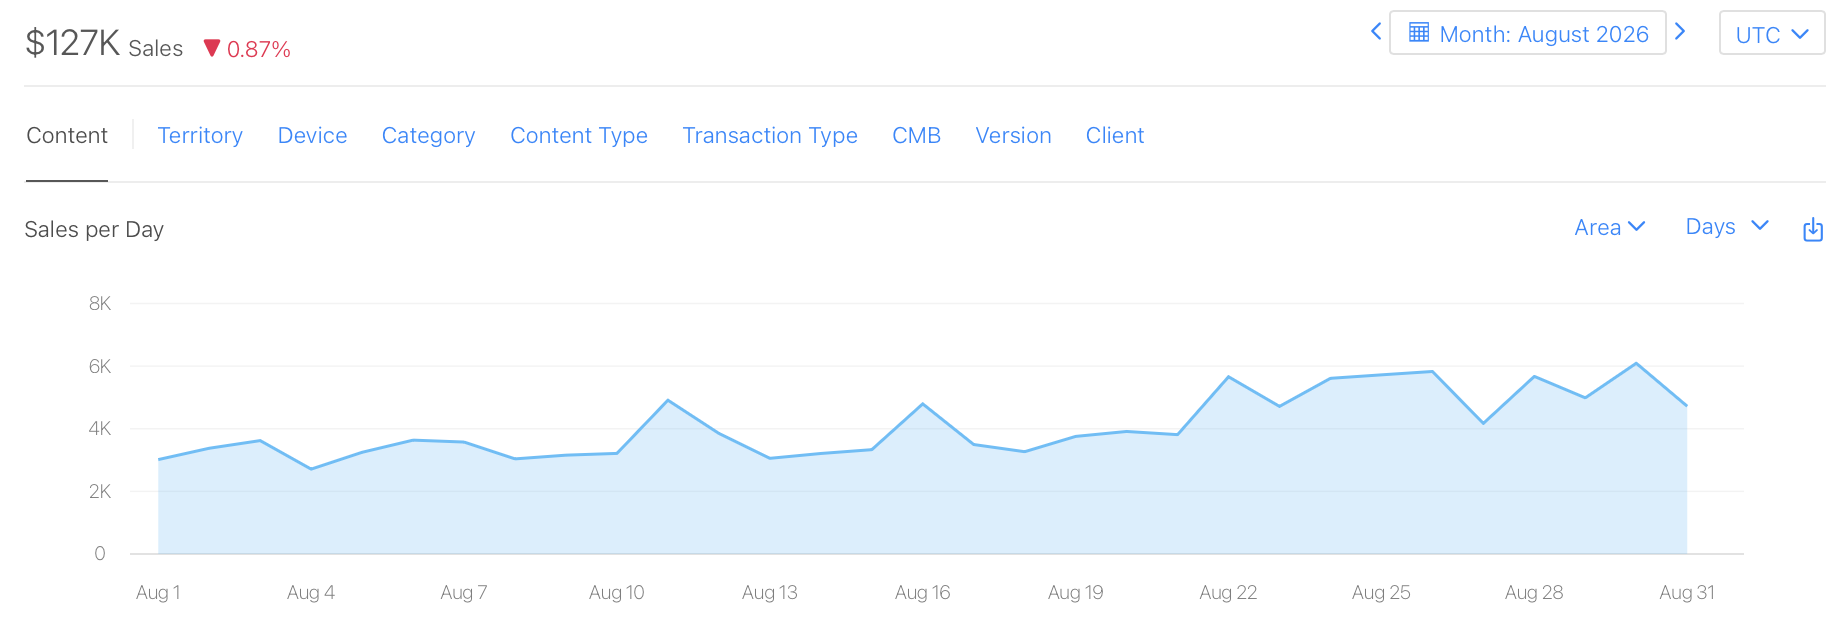
The calendar dates match the monthly advertising report, which records 8,096 attributed installs. Showing both reports adds context, but does not establish how much of the $127K came from those installs.
Seven-day sales: $36.1K
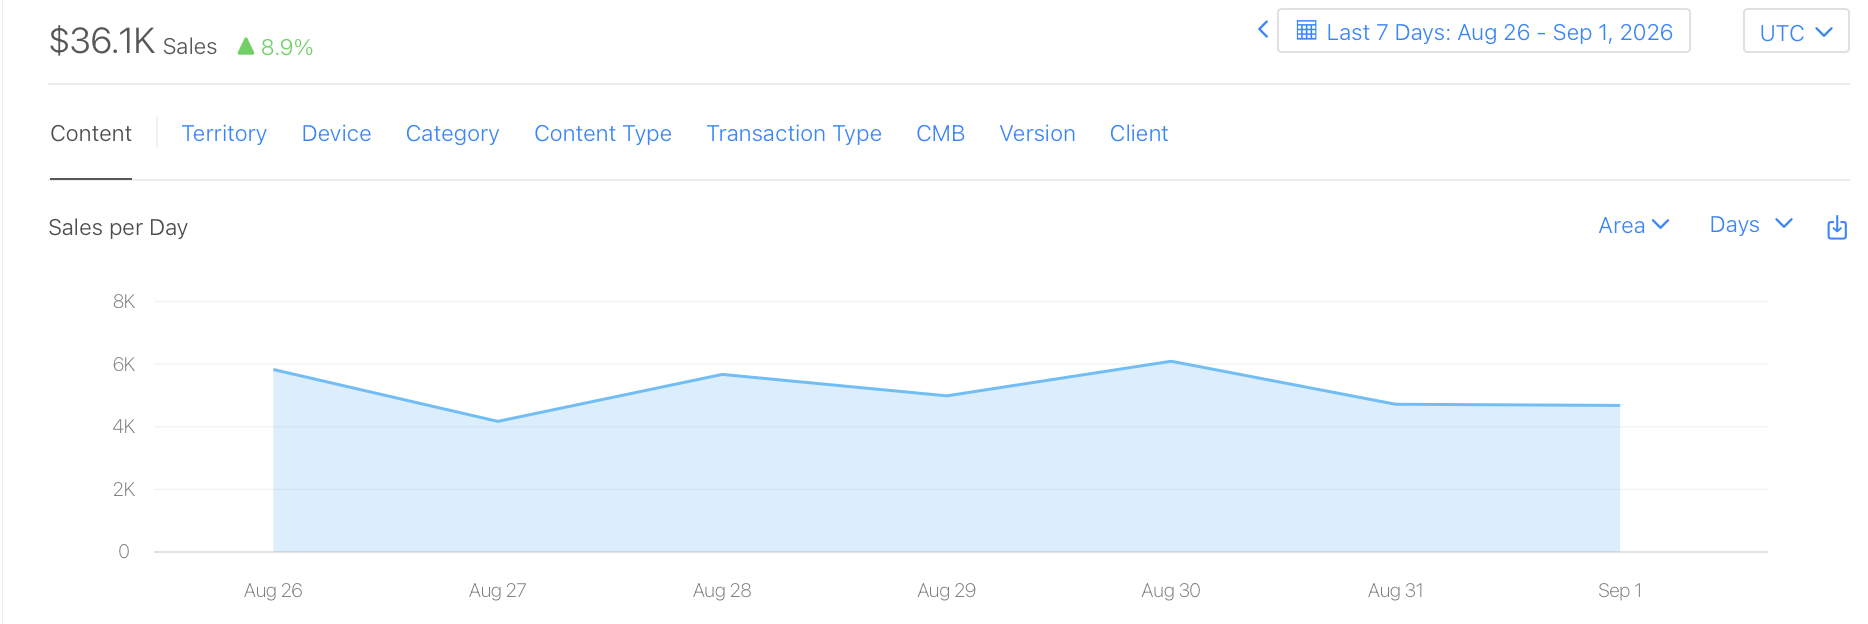
This is the same seven-day date window used for the 1,182 attributed installs above. It is a snapshot of reported sales, not proof that those installs generated $36.1K.
Sales and developer proceeds are different measures. Apple's Sales and Trends figures are estimates, while Payments and Financial Reports finalize payments. Apple's reporting comparison.
Sales reports can include organic customers, other acquisition channels, and renewals from earlier cohorts. Dividing these Sales totals by Apple Ads spend would not establish Apple Ads ROAS. That requires revenue attributable to the ad-acquired cohort, matching app and territory scope, and aligned currency and measurement windows. The sales screenshots show dollars while ad spend is in euros; no conversion or return calculation is made here.
What app developers can take from this case study
- Inspect the market, not just the account average. The largest market by volume was not the lowest-cost market.
- Compare campaign approaches within each country. The US and UK seven-day results did not favor the same approach.
- Separate brand and attribution types. Both materially affect the headline acquisition cost.
- Connect installs to customer value before scaling. Sales screenshots add context, but paid conversion, retention, and revenue for the ad-acquired cohort are still needed—not assumptions supplied by a low install cost.
The result is concrete: 54,806 attributed installs in the lifetime view, including 8,096 in August and 1,182 in the overlapping seven-day view, backed by dated dashboard captures. The broader lesson is a measurement habit: understand where the installs came from before deciding what to scale.
For the distinction between paid acquisition and organic visibility, read Apple Search Ads vs. ASO.
Screenshot privacy: Campaign names and app icons are blurred in the Apple Ads previews and linked full-size reports. Dates, performance figures, and App Store Connect sales screenshots are unchanged.
Sources, date ranges & methodology
Apple Ads source. Campaigns dashboard for the selected campaign group, captured September 2, 2026. Reporting timezone: UTC. The screenshots come from the live dashboard, excluding browser and account-header areas—not recreated. Campaign names and app icons are blurred for privacy; linked full reports preserve every listed row, all performance figures, and the totals.
Reporting windows and filters.
- Lifetime: June 16, 2016–September 1, 2026, the earliest accepted start through the last complete day. “View: All” returned 28 rows, including one removed campaign with zero metrics.
- Monthly: August 1–31, 2026. Seven-day: August 26–September 1, 2026. Both used “View: Enabled,” including paused campaigns, with no additional campaign filter.
- Lifetime means the history returned by this dashboard—not proof of continuous activity, an independently audited archive, or customer lifetime value. These windows overlap.
Calculations and reporting delays. Account totals and campaign CPAs retain Apple's displayed values. Derived figures use rounded campaign amounts. Attribution can arrive later; Apple warns that data received in the last three hours may not appear.
App Store Connect source. The supplied September 2, 2026 screenshots are unchanged. They display rounded Sales totals and UTC; app filters, territory scope, and currency code are not visible. The historical selector is April 17, 2023–September 6, 2026, with an incomplete final weekly bucket at capture. Monthly and seven-day sales dates match the corresponding advertising windows.
What this case study does not establish. Ad-attributed sales, ROAS, profitability, or causal improvement. No historical intervention or client-management attribution is asserted.